
Figure 8.
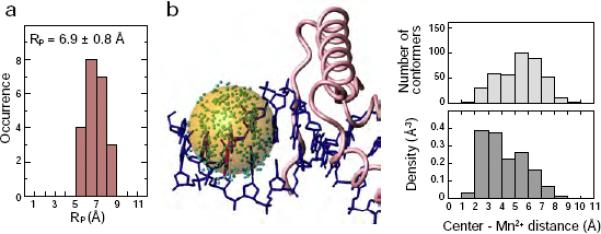
The distribution radius Rp of the EDTA-Mn2+ group in the SRY/DNA complex. (a) Histogram of RP calculated from S2 and <r−6>−1/6 for 22 Mn2+-1H vectors in the SRY/DNA-EDTAMn2+ complex. (b) Mn2+ distribution obtained by structure-based simulated annealing calculations. In the left panel of (b), the positions of Mn2+ for 400 different conformers are shown in green. The transparent orange sphere, with its origin placed at the center of the distribution, is drawn with a radius of 6.9 Å, corresponding to the average value of RP determined by the structure-independent method. In the right-hand panel of (b), a histogram of the distance from the center of the distribution to individual Mn2+ positions (top) and the density (bottom) of the Mn2+ for the 400 conformers (obtained by dividing the number of conformers by the volume of a shell with 1 Å thickness) are shown.