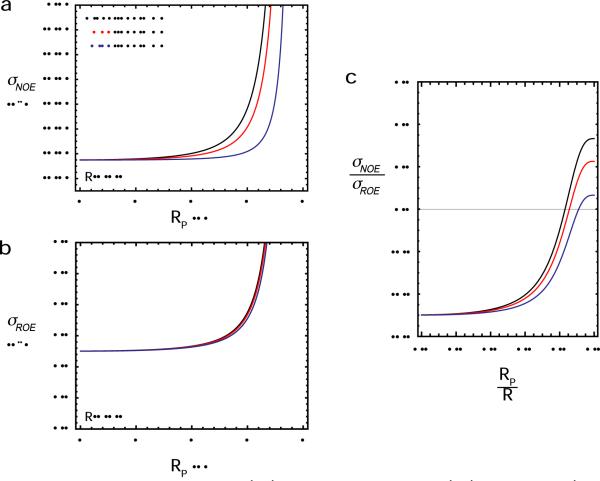
Figure 9.
Effect of the distribution radius on 1H-1H cross-relaxation rates. (a) 1H-1H NOE and (b) 1H-1H NOE cross-relaxation rates as a function of the distribution radius RP for the `Sphere' model with R = 4 Å and RN = 0 Å. The curves were obtained using Eqs. [18]–[20], together with Eqs. [4] and [7]. (c) Ratio of NOE to ROE cross-relaxation rates as a function of RP/R. For all panels, calculations at 1H frequencies of 500, 700, and 800 MHz (shown in black, red, and blue, respectively) were carried out with correlations times of τr = 9 ns and τi = 0.2 ns.

