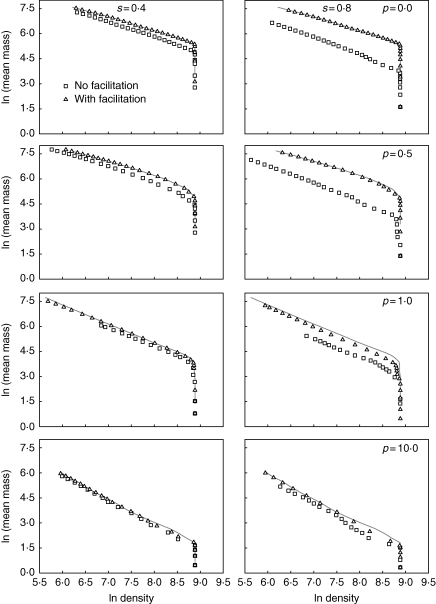
Fig. 1.
Self-thinning trajectories for simulated populations (7225 individuals) with and without facilitation under harsh conditions. s defines the level of stress (0–1), and p defines the size symmetry of competition (0: completely symmetric; 0·5: partially size symmetric; 1·0: perfectly size-symmetric; 10·0: highly size-asymmetric). For comparison, results for benign conditions (s = 0·0) are shown as grey lines on each figure.

