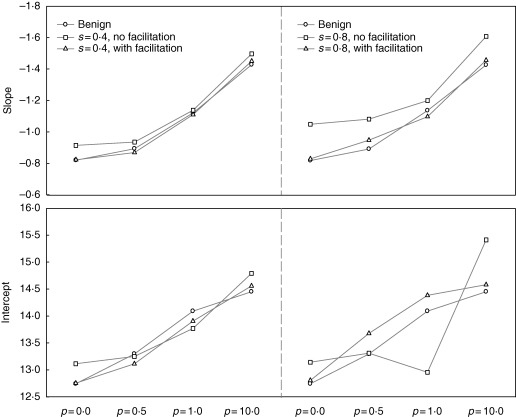
Fig. 2.
Comparisons of self-thinning slopes (upper panels) and intercepts (lower panels) of the relationships between survivor densities and mean individual mass in simulated populations. s defines the level of stress (0–1), and p defines the size symmetry of competition (0: completely symmetric; 0·5: partially size-symmetric; 1·0: perfectly size-symmetric; 10·0: highly size-asymmetric).

