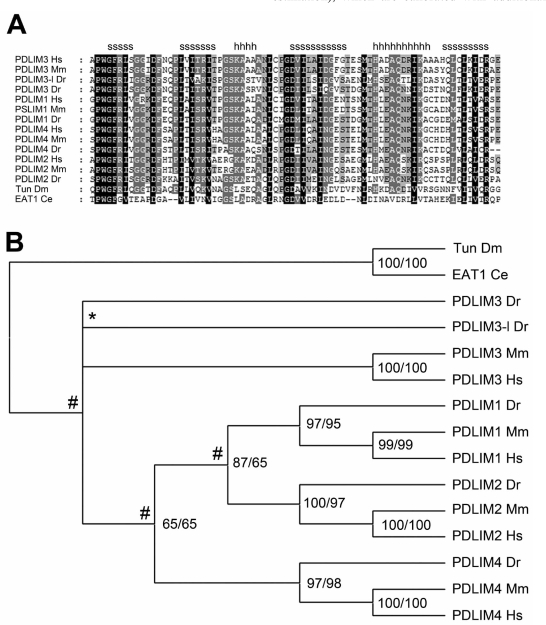
Fig. (1).
Example of sequence alignment and phylogeny. (A) This figure shows an example alignment of the PDZ domain with different shadings representing the amount of conservation (100, 75 or 50%) at a particular position in the sequence. (B) This tree is the phylogenetic presentation of the alignment in Fig. (1A). It was computed using Bayesian estimation and presents the best-supported topology for the alignment. Numbers indicate % support by the two methods used, while # indicates gene duplication events in the common ancestor and * marks a species-specific duplication event. For computational details, please see [42].

