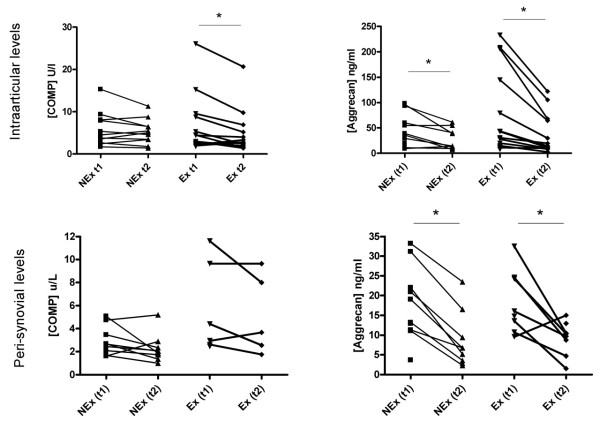
Figure 5.
Intraarticular (top row) and peri-synovial (bottom row) concentrations of COMP and Aggrecan. Each point represents a mean of the measured values and each connecting line represents a subject with before/after values. COMP remained stationary in the NEx group in both compartments and in the Ex group peri-synovially over time, but decreased in the Ex group intraarticularly, whereas Aggrecan concentrations decreased significantly from T1 to T2 in both positions regardless of exercise (*P < 0.05).

