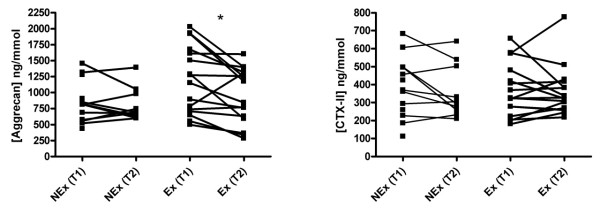
Figure 6.
Creatinine-corrected urinary concentrations of Aggrecan and CTX-II in NEx and Ex groups at T1 and T2. Each point represents a mean of the measured values and each connecting line represents a subject with before/after values. The Ex group had a significantly higher level of Aggrecan in the urine immediately after exercise compared to the values after three hours of microdialysis (rest), whereas the NEx group showed no significant difference between T1 and T2 (*P < 0.05). CTX-II displayed no changes over time.

