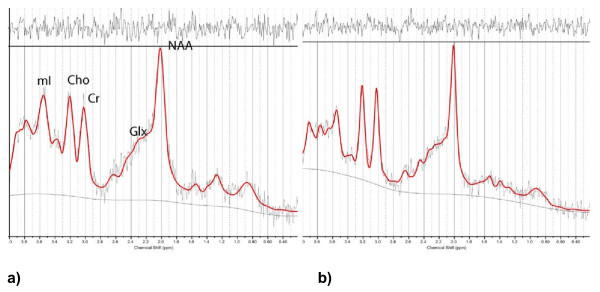
Figure 2.
Left hippocampus spectrum. A control patient (a) and a patient with fibromyalgia (FM) (b). For the patient with FM, a decrease in the myoinositol peak amplitude and in the relation to creatine was noted. The black line indicates the averaged spectrum; the red line indicates the LCModel fit. The residuals, calculated as a subtraction of the fit from the average spectrum, are plotted at the top.

