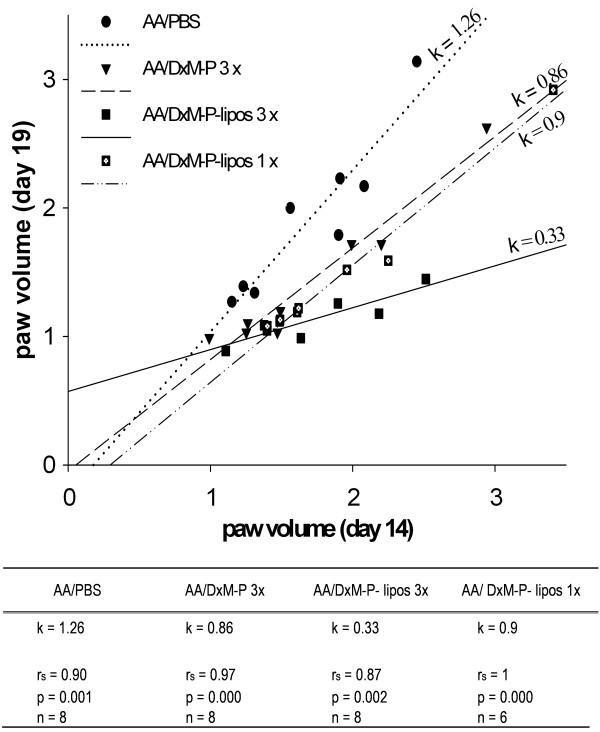
Figure 3.
Correlation between the paw volume on Days 14 and 19 during the time course of adjuvant arthritis. Correlation (Spearman rank test, rs) between the paw volume on Day 19 (maximal efficacy of treatment) and Day 14 (prior to treatment) of individual rats treated with PBS (3 ×; Days 14, 15 and 16; n = 8), free DxM-P (3 × 1 mg/kg; Days 14, 15 and 16; n = 8), or liposomal DxM-P (3 × 1 mg/kg; Days 14, 15 and 16; n = 8; or 1 × 1 mg/kg; Day 14; n = 6). The solid, dashed, and dotted lines are the regression lines, k represents the regression gradient.

