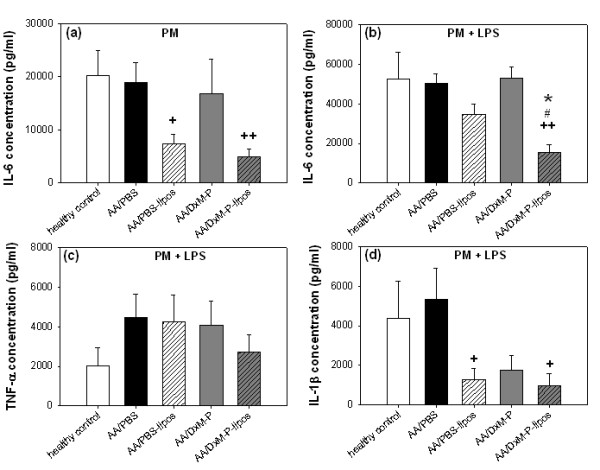
Figure 7.

Cytokine production by peritoneal Mφ in adjuvant arthritis (Day 21; Experiment 2/3). IL-6 (a-b), TNF-α (c), and IL-1β (d) production by non-stimulated and LPS-stimulated peritoneal Mφ after treatment as in Figure 1; n = 4 for all groups. + P ≤ 0.05, ++ P ≤ 0.01 vs. AA/PBS; # P ≤ 0.05 vs. AA/PBS-liposomes; * P ≤ 0.05 vs. AA/DxM-P; all Mann Whitney U-test.
