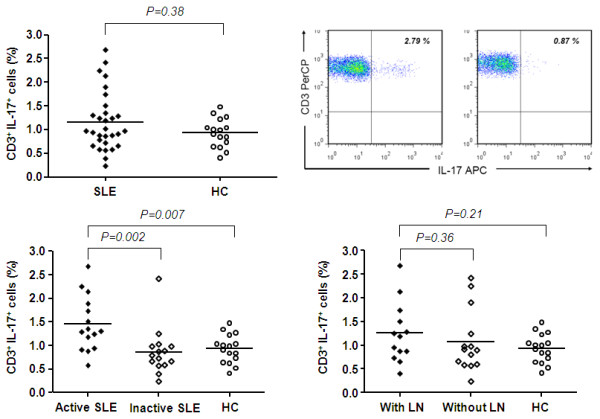
Figure 1.

IL-17 producing CD3+ T-cells in systemic lupus erythematosus. (a) Percentages of IL-17 producing CD3+ cells in patients with SLE (n = 30) and healthy controls (HC) (n = 16). (b) A representative two colour immunofluorescence dot plot of CD3+ cells showing expression levels of IL-17 from an SLE patient and a healthy control. Cells positive for both antibodies are represented in the right upper quadrant with the percentage indicated. (c) Percentages of IL-17 producing CD3+ cells in active patients (n = 15), inactive patients (n = 15) and healthy controls (n = 16). (d) Percentages of IL-17 producing CD3+ cells in patients with lupus nephritis (with LN) (n = 13), patients without lupus nephritis (without LN) (n = 14) and healthy controls (n = 16). Data are presented as mean value. Significance was tested by the Mann-Whitney U-test. A P-value less than 0.05 was considered significant.
