
Figure 2.
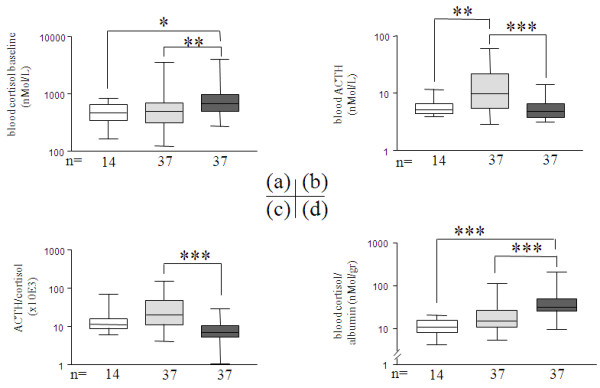
On ICU-admission blood concentrations of cortisol; ACTH; ACTH-to-cortisol and cortisol-to-albumin ratios. Three groups were compared: normal volunteers (white bars, n = 14), non-septic ICU patients (light grey bars, n = 37), septic ICU patients (dark grey bars, n = 37). Graphs represent analysis (median, box 25th to 75th percentile range; error bars 10th to 90th percentile range) of (a) cortisol baseline (nMol/L), (b) ACTH (nMol/L), (c) ACTH-to-cortisol ratio, (d) cortisol-to-albumin. The Y axis is shown in logarithmic scale. P is indicative of significant difference(s) between groups: *: P ≤ 0.05, **: P ≤ 0.01, ***: P ≤ 0.001.