
Figure 3.
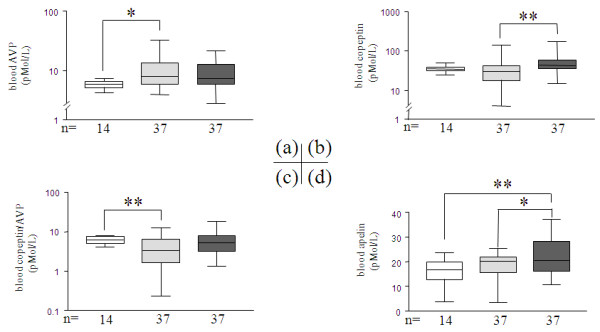
On ICU-admission blood concentrations of arginine-vasopressin (AVP); copeptin; copeptin-to-AVP ratio, and apelin (APL). The three groups were compared in bar charts as described in Figure 1, and represent (a) AVP (pMol/L), (b) copeptin (pMol/L), (c) copeptin-to-AVP ratio, (d) apelin (APL, pMol/L). The Y axis is shown in logarithmic scale except for panel F which is linear. P is indicative of significant difference(s) between groups: *: P ≤ 0.05, **: P ≤ 0.01.