
Figure 5.
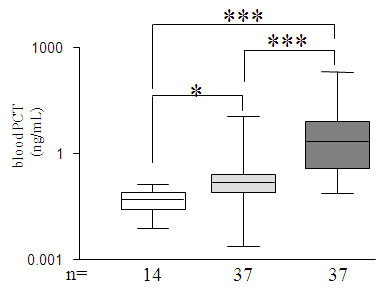
On ICU-admission blood concentrations of procalcitonin (PCT). The three groups were compared in bar charts as described in Figure 1, representing PCT (ng/mL) in studied groups. The Y axis is in logarithmic scale. P are indicative of significant difference(s) between groups: *: P ≤ 0.05, ***: P ≤ 0.001.