
Figure 6.
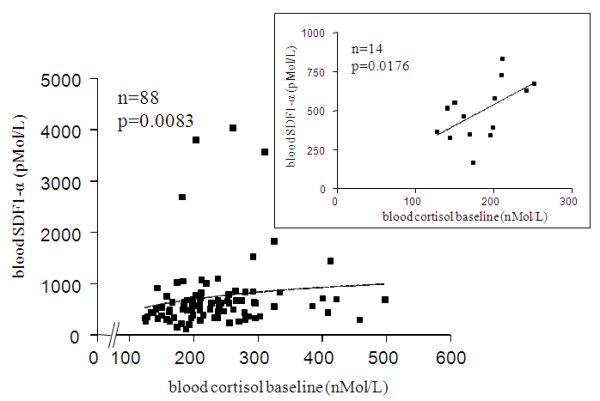
Correlation between blood SDF-1α and cortisol baseline. The overall studied population sample (including normal subjects) is shown included in the main panel: r = 0.2827 (95% CI: 0.06899 to 0.4717). The insert shows the strongest association between these two parameters found in healthy volunteers after subgroup analyses: r = 0.6220, (95% CI: -0.1191 to 0.8709).