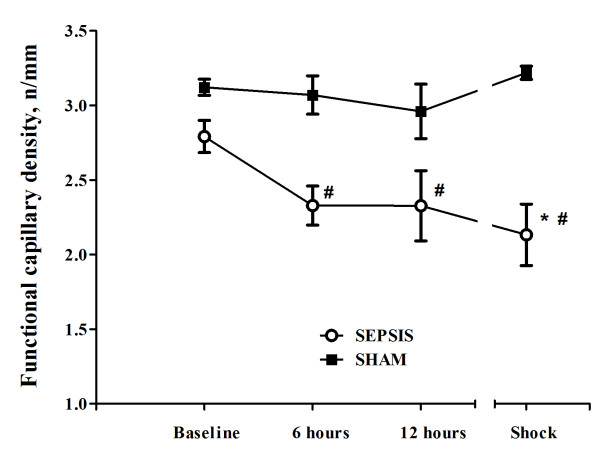
Figure 5.
Changes in cerebral functional capillary density (FCD) in the septic (n = 10) and the sham (n = 5) animals. Data are presented as mean ± SD. ANOVA analysis for FCD: P = 0.049 (time, sepsis group) and P < 0.001 (group). ANOVA analysis for PSPV: P = 0.02 (time, sepsis group) and P < 0.001 (group). P-value <.05 vs. baseline (*) or vs. sham (#) in post-hoc Bonferroni correction.

