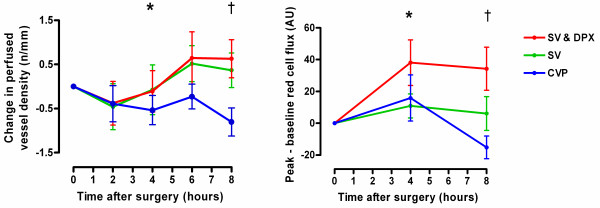
Figure 3.
Changes in (a) sublingual perfused vessel density and (b) peak-baseline cutaneous red cell flux following three minutes of vascular occlusion from hour 0 following surgery in the three treatment groups. *Significant difference between groups over time for sublingual vessel density (P < 0.05) and cutaneous hyperaemic response (P < 0.01) (two-way repeated measures analysis of variance). Significant increase in perfused sublingual vessel density over time in the SV & DPX group (P = 0.046), no change in the SV group (P = 0.58) and a decrease in the CVP group (P = 0.005). Significant increase in cutaneous hyperaemic response over time in the SV & DPX group (P = 0.003), no change in the SV group (P = 0.58) and a decrease in the CVP group (P = 0.03). †At hour eight, there was a significant difference in perfused sublingual vessel density between the SV & DPX and CVP groups (P < 0.05) but not between the SV and CVP groups (P > 0.05). At hour eight, there was a significant difference in cutaneous hyperaemic response between the SV & DPX and CVP groups (P < 0.001) but not between the SV and CVP groups (P > 0.05). CVP, central venous pressure; DPX, dopexamine; SV, stroke volume.

