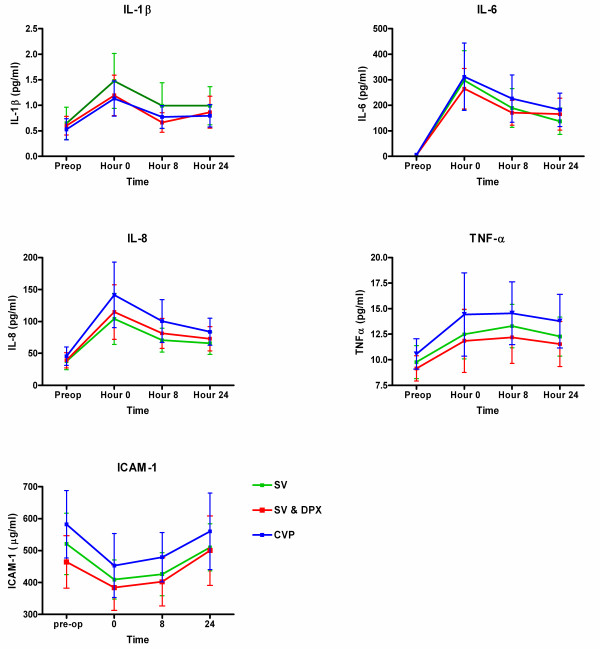
Figure 5.
Changes in (a) serum IL-1β, (b) IL-6, (c) IL-8, (d) TNFα and (e) soluble inter-cellular adhesion molecule 1 between the three treatment groups. Data presented as mean (standard error). There were no significant differences between the groups. CVP, central venous pressure; DPX, dopexamine; ICAM-1, inter-cellular adhesion molecule 1; SV, stroke volume.

