Figure 4.

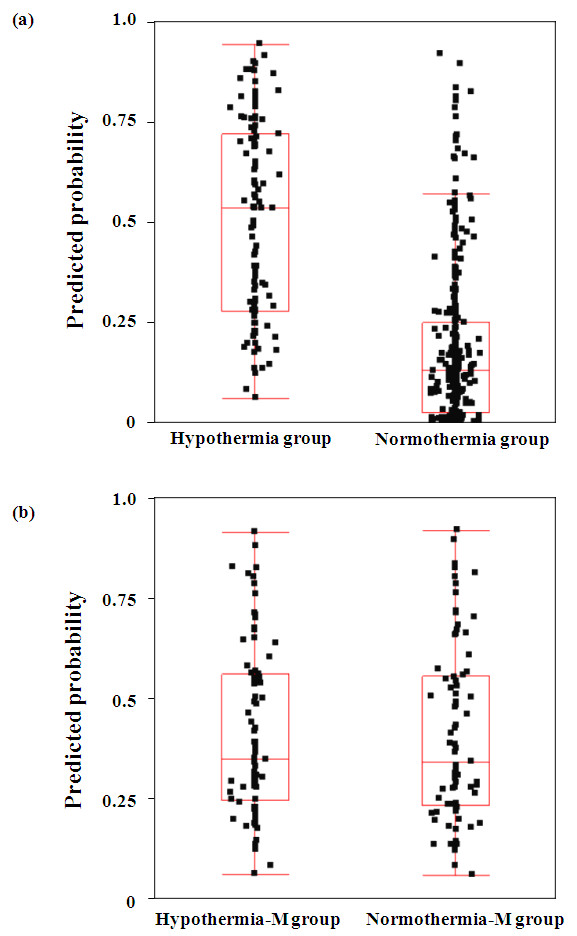
Distribution of propensity scores. Distribution of propensity scores (a) in the hypothermia and normothermia groups and (b) in the matched hypothermia-M and normothermia-M groups.

Distribution of propensity scores. Distribution of propensity scores (a) in the hypothermia and normothermia groups and (b) in the matched hypothermia-M and normothermia-M groups.