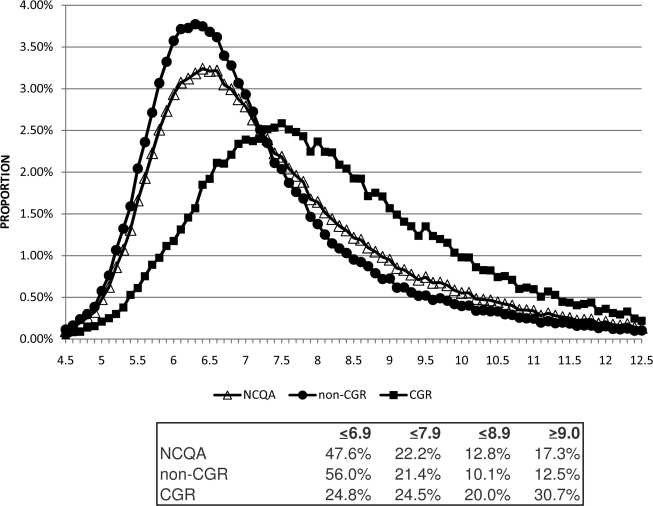
Figure 1.
The percentages of A1C values occurring in 0.1% intervals are plotted separately for each of the denominators. The percentage within each nonoverlapping A1C range within each denominator is reported. Relatively similar distributions are observed for the NCQA (△) and non-CGR(●), whereas the CGR (■) distribution differed more markedly in both skewness and kurtosis as a result of a greater proportion of patients having higher A1C values.

