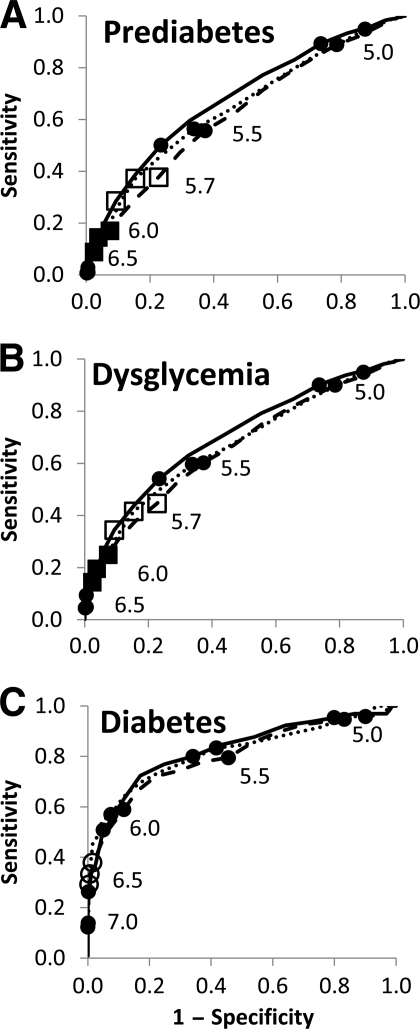
Figure 1.
ROC curve analyses for each of the three datasets, showing A1C screening to detect pre-diabetes, dysglycemia, and diabetes. A: Pre-diabetes. B: Dysglycemia. C: Diabetes. ●, 0.5% intervals of A1C; ○, ADA and IEC cutoff for diabetes at A1C = 6.5%; □, ADA cutoff for high risk at A1C = 5.7%; ■, IEC cutoff for high risk at A1C = 6.0%. Points are labeled with A1C values. · · · · ·, SIGT study; – – –, NHANES III; ——, NHANES 2005–2006.

