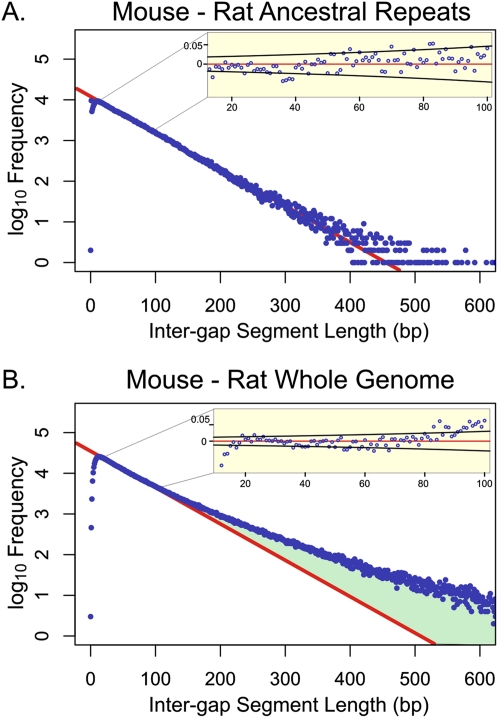
Figure 1.
Representative genomic distributions of IGS lengths in mouse–rat alignments. Frequencies of IGS (blue) are shown on a log10 scale for AR regions (A) and whole-genome sequences (B) with G+C contents of 0.415–0.425. The red line represents the prediction of the neutral indel model, a geometric distribution of IGS lengths calibrated over IGS ∼15–80 bp in length. For mouse–rat AR sequence, the observed data accurately fit the predictions of the neutral indel model, with no deviation from the model apparent within this interval (inset shows residuals, and 95% confidence bounds in black based on a Bernoulli model). For whole-genome alignments, the data fit accurately for IGS 10–100 bp in length. Beyond 100 bp, there is an excess of longer IGS (green), representing sequence which contains fewer indels than would be predicted under the neutral indel model. The underrepresentation of short IGS (<10) is due to “gap attraction,” an artifact of the alignment process (Lunter et al. 2008). Histograms for the 19 remaining G+C bands are provided as Supplemental Figure 1.

