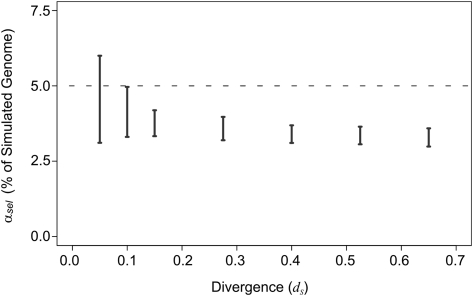
Figure 3.
Estimates of constrained sequence (black bars) in simulated genomes. Simulated genomes contained 5% of constrained sequence (broken line). Constrained sequence rejects 90% of indel events. The neutral indel model consistently underestimates the true quantity of conserved sequence for genome pairs with more than one substitution per neutral base. Only at a divergence of 0.1 does the upper-bound estimate approach the true quantity of constrained sequence. Over divergences of 0.15 to 0.65, the reduction in estimates of constraint is minimal. This is in contrast to observations in alignments of real mammalian genome assemblies, for which there is a 2.2-fold difference over the same evolutionary range (Fig. 2).

