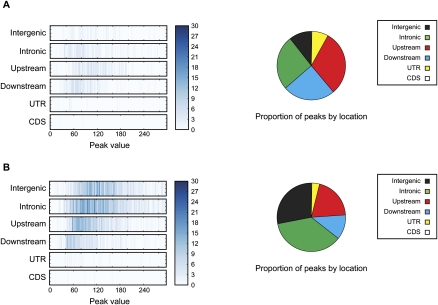
Figure 1.
VDR binding intervals and genomic location. (A) Unstimulated cells. (B) Calcitrol-stimulated cells. Enrichment is shown by location with respect to gene structure (y-axis) and binding strength (peak value, maximum number of reads aligned to a genomic position within a ChIP-seq interval) (x–axis). Pie charts summarize the percentage of VDR binding sites based on location. Intergenic regions were defined as at least 5 kb away from the first or last exon of a gene, upstream (promoter) regions defined as within 5 kb of the transcriptional start site, and downstream regions as within 5 kb from the end of the last exon.

