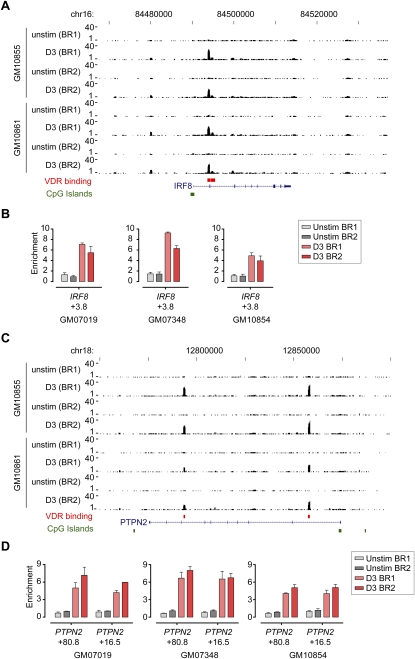
Figure 4.
VDR ChIP-seq analysis for IRF8 and PTPN2. VDR ChIP-seq data shown for two biological replicates of two LCLs, GM10855 and GM10861, either resting or after induction with calcitriol for 36 h. (A) Tracks shown for IRF8 (chr16: 84,467,000–84,537,000) with a novel site of VDR occupancy noted at +3.8 kb relative to the transcriptional start site (TSS), as well as weaker sites at −10.2 kb and +4.7 kb. (B) Validation of VDR binding by ChIP for GM07019, GM07348, and GM10854 analyzed by quantitative real-time PCR. Mean fold difference (±SD) in enrichment of each of the PCR amplicons is expressed relative to input DNA. (C) Tracks also shown for PTPN2 (chr18: 12,750,000–12,900,000) with VDR occupancy in intron 1 (+16.5 kb relative to the TSS of PTPN2) and intron 7 (+80.8 kb) with (D) validation by ChIP for GM07019, GM07348, and GM10854.

