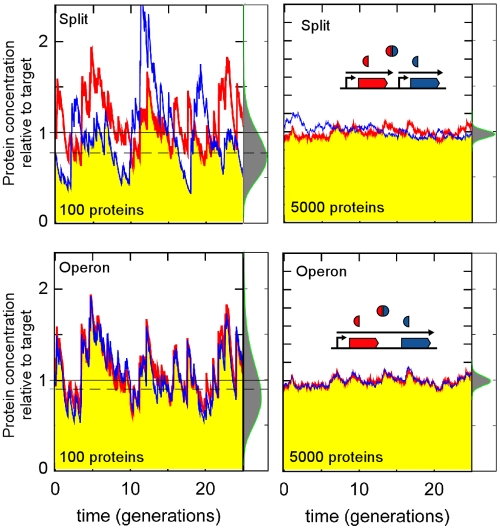
FIG 1 .
The cost of protein complex formation is improved by operon organization. The red and blue traces show fluctuations in the numbers of two proteins produced stochastically in equimolar amounts from two separate promoters (top) or a single promoter (bottom). The yellow areas show the concentration of a 1:1 complex of the proteins (minimum of two proteins for a tight complex). Individual RNA production, degradation, and translation events were random, with rates such that per generation, an average of 5 (left) or 250 (right) mRNAs were made, each producing 20 proteins on average. Proteins were stable and randomly distributed upon cell division. The distributions of the number of complexes are shown on the side of the traces. Mean values (dashed lines) for the left panels are 78 (top) and 93 (bottom) and for the right panels are 4,851 (top) and 4,958 (bottom). The average complex levels fall short of the target, but the shortfall is larger when proteins are transcribed separately and when mRNA numbers are smaller. Conversely, fluctuations in complex numbers (i.e., the widths of the distributions) are larger when the two proteins are cotranscribed.

