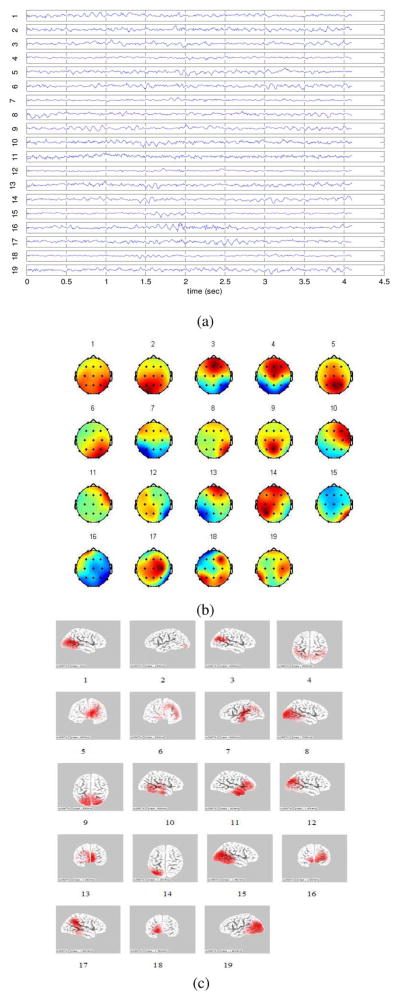
Fig. 2.
(a) The time series of the ICs extracted from a single EEG epoch. (b) The topographies of these ICs. (c) The respective source distributions of the ICs obtained from sLORETA. The ICs, the associated topographies and source distributions are labeled by numbers. It is shown in (c) that, some of the ICs, such as 4, 5, 6, 9, 13, and 16, have truly distributed sources.

