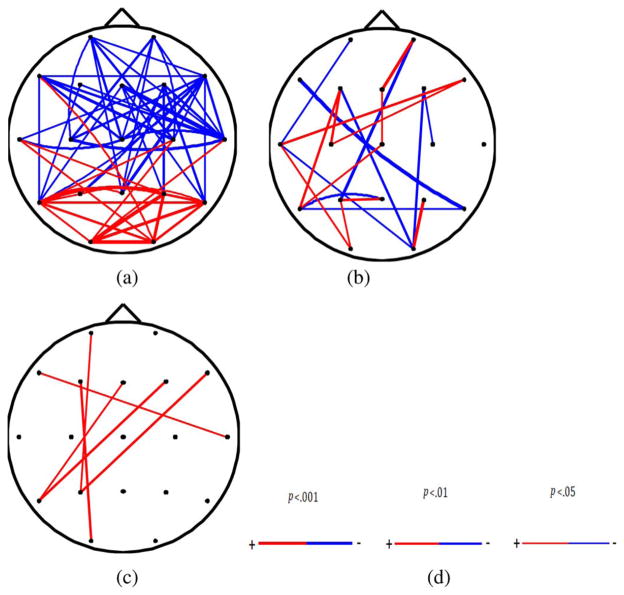
Fig. 4.
(a) significant changes in connectivity due to concussion (p < 0.05). Color “blue” indicates significant decrease due to concussion and “red” indicates significant increase due to concussion. The thickness of the lines indicates the significant level (b) significant changes in the iCOH within alpha band due to MTBI (p < 0.01). (c) Significant changes in the COH within alpha band due to MTBI (p < 0.01). (d) Color “blue” indicates significant decrease due to MTBI and “red” indicates significant increase due to concussion. The thickness of the lines indicates the significant level from 0.05 to 0.001.

