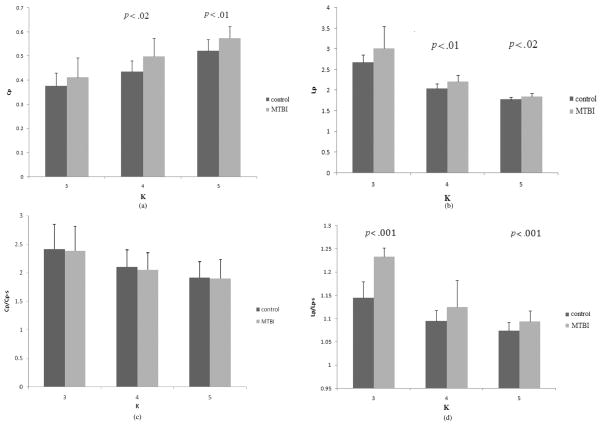
Fig. 5.
(a) The cluster coefficient (Cp) before and after MTBI when the functional networks have different values of K. The Cp is significantly increased after MTBI when K = 4 and 5. (b) The averaged path length (Lp) before and after MTBI when the functional networks has different values of K. The Lp after MTBI significantly increased when K = 4 and 5. (c) The Cp/Cp–S ratio before and after MTBI. No significant differences for all Ks. (d) The Lp/Lp–S ratio before and after MTBI. There is a significant increase after MTBI, when K = 3 and 5.

