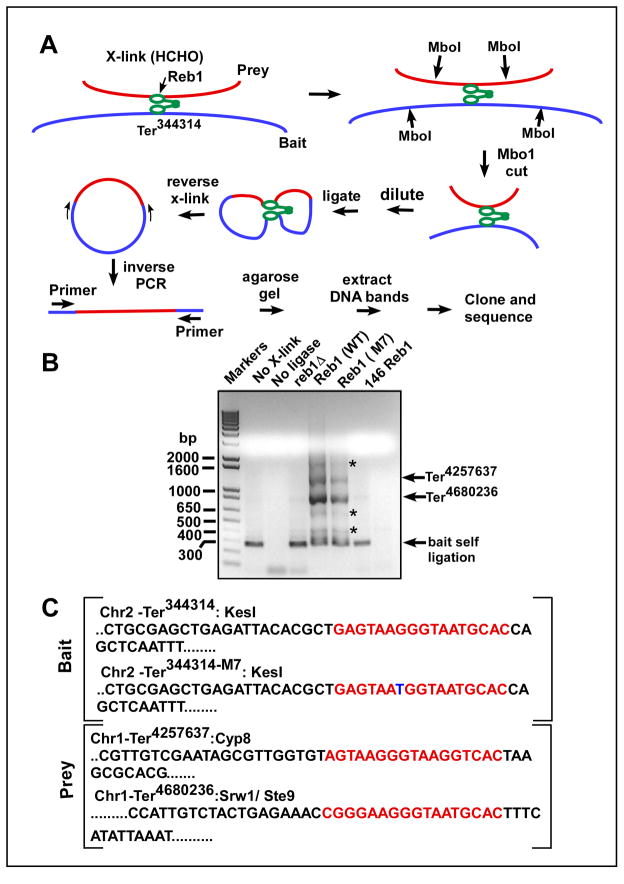
Fig. 6. Identification of sequences interacting with Ter344314 by 4C analysis.
A, schematic diagram showing the major steps of 4C analysis, the key enzymes/manipulation used at each step are indicated (see the text for further explanation); B, representative agarose gel of the inverse PCR products from a representative 4C analysis that used Ter344314 and Ter344314-M7 as baits, the asterisks show faint minor products that were found to be nonspecific PCR products, the lanes marked Reb1 (WT) and Reb1 (M7) refer to products from cells expressing WT Reb1 protein and which contained the Ter344314 and Ter344314-M7 bait sequences respectively; C, sequences of the bait and the prey sites; the two prey sequences captured by 4C namely Ter4680236 and Ter4257637 are both located in chromosome I, the third major band was self ligated bait sequence which, as expected, is missing from the ligase minus control lane in B (the primer sequences are shown in supplementary data).

