Figure 2.
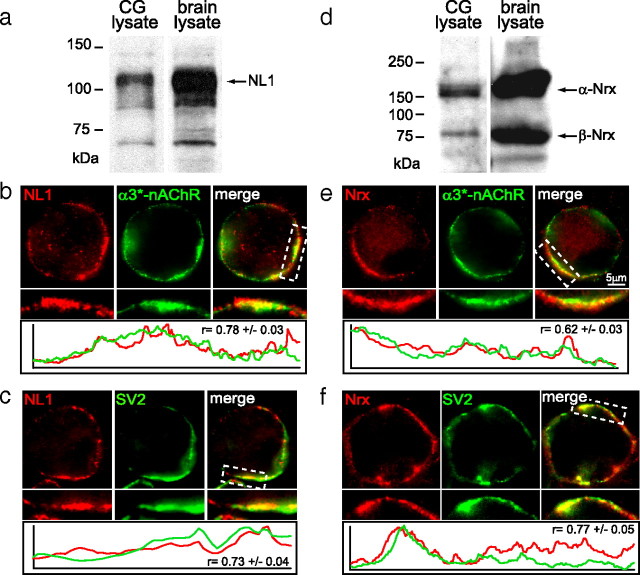
Neuroligin and neurexin are enriched at CG nicotinic synapses in vivo. a, d, Immunoblot analyses of lysates from chicken CG and brain, for comparison, show protein bands of the expected sizes for neuroligin (NL) (∼110 kDa) and neurexin (Nrx) (∼160 kDa for α-Nrx and ∼75 kDa for β-Nrx). b, c, e, f, Micrographs of immunofluorescence double-labeled E12–E14 CG frozen sections show that NL surface clusters (red; b, c) colocalize with α3*-nAChRs clusters (green; b) and partially overlap with the SV2-positive presynaptic terminal (green; c). Similarly, Nrx surface clusters (red; e, f) partially overlap with postsynaptic α3*-nAChR clusters (green; e) and the presynaptic terminal stained for SV2 (green; f). Bottom, Red and green fluorescence intensity profiles for boxed regions; r, correlation coefficients for colocalization (n = 15–18 neurons).

