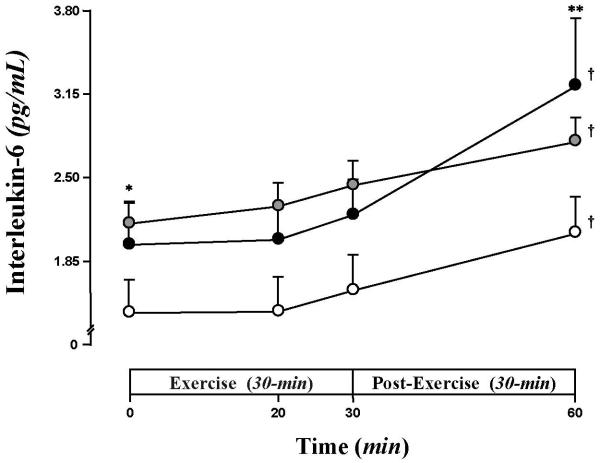
Fig. 3. Baseline and exercise-induced increases in IL-6.
IL-6 was significantly elevated at baseline for Ob (grey circle) than CL (white circle), whereas T1DM (black circle) was intermediate. IL-6 increased significantly after exercise; IL-6 was higher in Ob than CL throughout the protocol, while T1DM displayed the greatest post exercise-induced change. Data are mean±SE. * (p<0.005), Ob vs. CL at baseline; † (p<0.005), exercise-induced increases within groups; ** (p<0.0167), exercise-induced patterns T1DM vs. CL and Ob.

