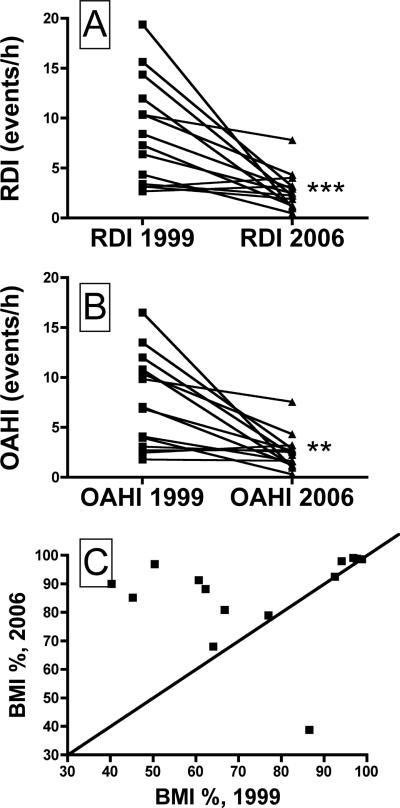
Figure 1.
The respiratory disturbance index (RDI, panel A) and the obstructive apnea-hypopnea index (OAHI, panel B) recorded in 1999 and in 2006, for all 14 subjects. The OAHI declined in every subject. See Table 1 for average values, and text for description of how the RDI and OAHI values were calculated. **, Different than 1999 at P<0.01; ***, Different than 1999 at P<0.001. Panel C shows the BMI percentile values for each subject, in 1999 and 2006. The line of identity is shown, and it is clear that most subjects were in a much higher percentile in 2006 compared to 1999 (see text for details).

