
Figure 6. Translation State Array Analysis of Heat Shock Responses in C. elegans.
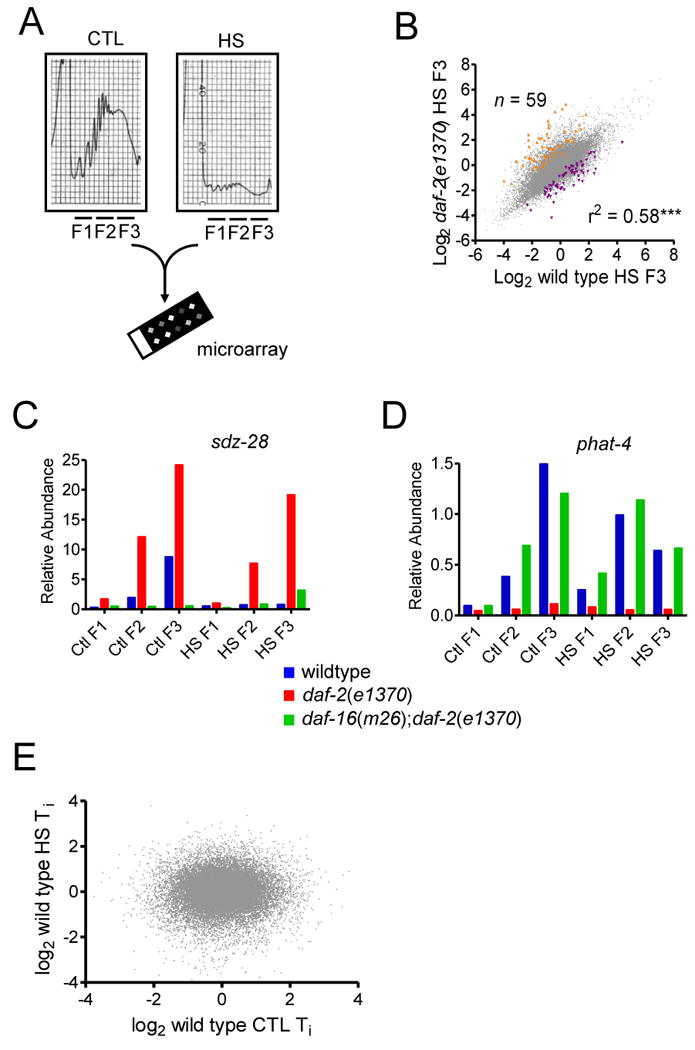
(A) Schematic of Translation State Array experimental design. (B) Scatter plot of log2 wild type HS F3 versus daf-2(e1370) log2 HS F3 versus. Transcripts with significantly altered abundance were identified via t-tests and a FDR ≤ 0.05. Transcripts significantly increased in daf-2(e1370) shown in orange (n = number of data points) and those decreased shown in purple, r2 denotes the correlation coefficient and ** p<0.01. (C) Plot of Relative Abundance of the sdz-28 transcript in each fraction (F1-F3) under control (CTL) and HS treatments (HS). Each bar represent mean of 4 biological replicates. (D) Plot of Relative Abundance of the phat-4 transcript in each fraction (F1-F3) under control (CTL) and HS treatments (HS). Each bar represent mean of 4 biological replicates. (E) Scatter plot of log2 wild type CTL Ti (i.e. F3/F2) versus log2 wild type HS Ti.