Fig. 5.
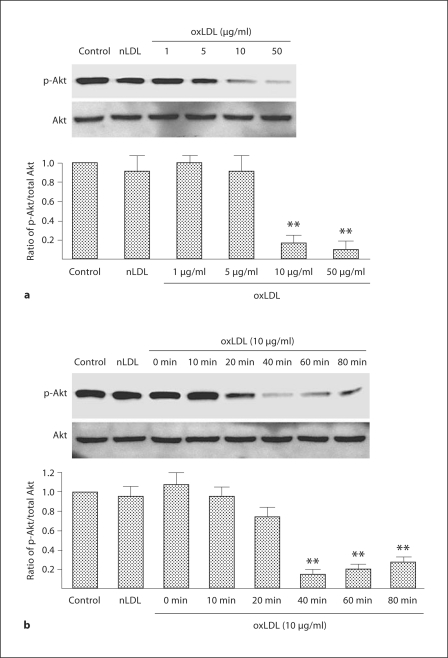
Time- and dose-response relationships between oxLDL and the expression of Akt and p-Akt in wild-type EPC. a EPC cultures were exposed to nLDL (10 μg/ml) or oxLDL (1–50 μg/ml) in serum-free medium; the control well was treated with serum-free medium alone. Density of the Akt and p-Akt bands were first corrected with respect to β-actin (not shown) and then the ratio of p-Akt/total Akt expression calculated. The ratio of the wild-type group was assigned a value of 1.0. Data are presented as mean ± SD, n = 3; ** p < 0.01 oxLDL versus nLDL or control. b EPC cultures were exposed to nLDL (10 μg/ml) or oxLDL (10 μg/ml) in serum-free medium for 0–80 min; the control well was treated with serum-free medium alone. Density of the Akt and p-Akt bands were first corrected with respect to β-actin (not shown) and then the ratio of p-Akt/total Akt expression calculated. The ratio of the control group was assigned a value of 1.0. Data are presented as mean ± SD, n = 3; ** p < 0.01 oxLDL versus nLDL or control.

