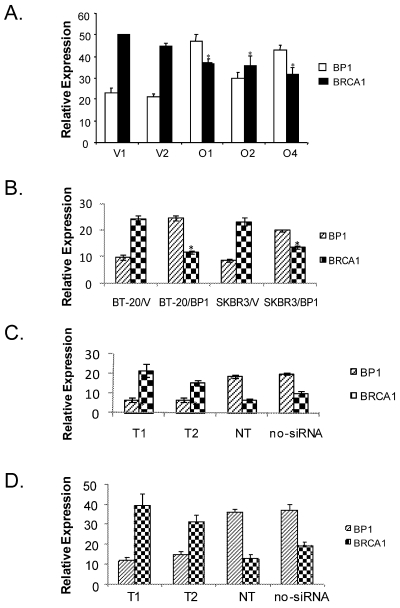
Figure 3.
Real-time RT-PCR analysis of BP1 and BRCA1 expression. Relative BP1 and BRCA1 mRNA expression levels were quantified by real-time RT-PCR and normalized against 18S expression levels. Data are the mean ± standard error for three experiments for BRCA1 and BP1 with duplicates each. Student's t test was done for statistical significance analysis (*P < 0.05). A. Stable MCF7 BP1 overexpressors (O1, O2, and O4) vs. vector controls (V1 and V2). B. Transient BP1 overexpressor (BT-20/BP1) vs. vector control (BT-20/V); and transient BP1 overexpressor (SKBR3/BP1) vs. vector control (SKBR3/V). C. T47D cells treated with BP1 siRNA target T1 and T2 respectively comparing non-targeting (NT) and no siRNA controls. D. MDA-MB-231 cells treated with BP1 siRNA target T1 and T2 respectively comparing non-targeting (NT) and no siRNA controls.

