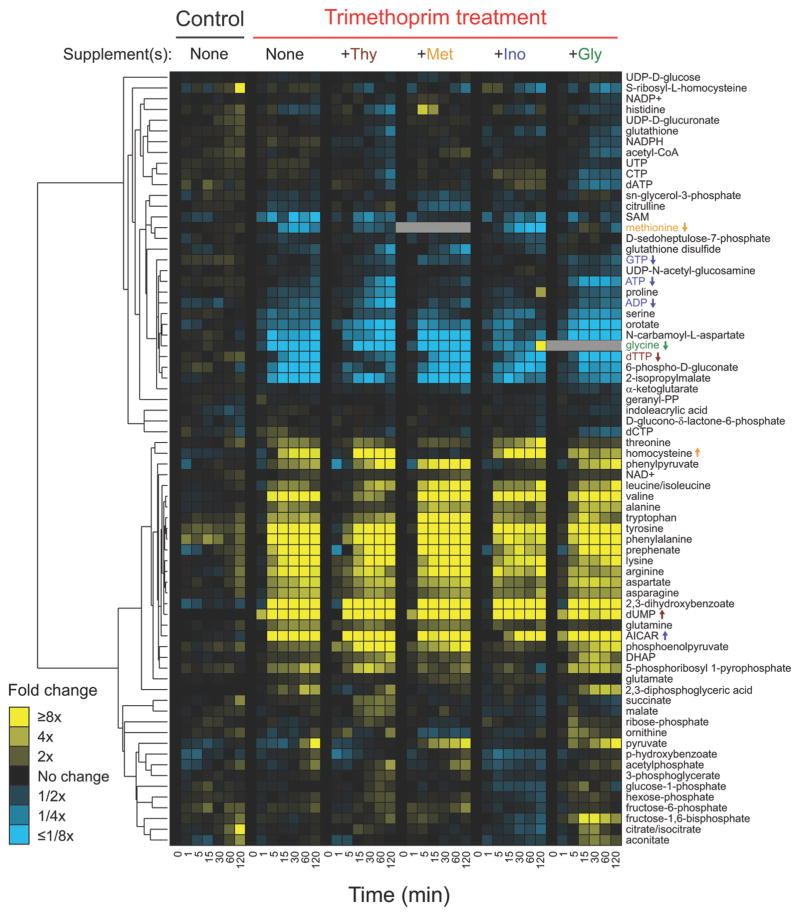
Figure 1.
Profiles of 72 intracellular metabolites in wildtype E. coli treated with trimethoprim while growing in minimal media containing indicated supplements. Relative levels are expressed as the log ratio of the normalized signal intensity in drug-treated cells at each time point to the normalized signal intensity in the drug-free time 0 sample (n ≥ 2 independent experiments). Signal intensity was normalized to the cell optical density (A650) at each time point. In cases of exogenous glycine and/or methionine addition, glycine and methionine levels are not reported because intracellular pools could not be differentiated from extracellular pools.

