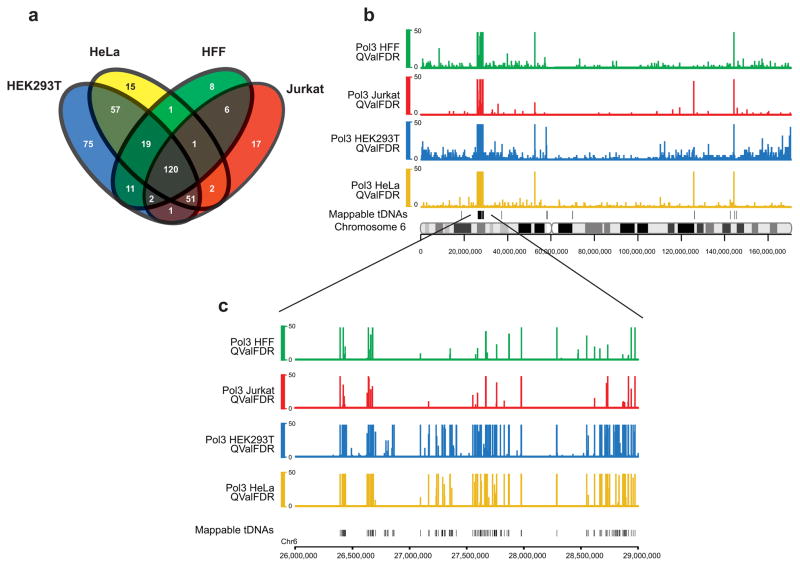
Figure 2.
Differential Pol III occupancy in various cell types. (a) Intersection analysis of the known Pol III occupied genes between the four cell types. Pol III bound regions (top 400 enriched loci) were filtered for unannotated regions and only known genes were used for the analysis. Total numbers of genes for HEK293T, HeLa, Jurkat, and HFF were 336, 266, 200, and 168, respectively. (b) A snapshot of chromosome 6 showing Pol III occupancy in HeLa (yellow), HEK293T (blue), Jurkat (red) and Human Foreskin Fibroblasts (HFF, green) and mappable tDNAs on a separate track. (c) A zoomed-in view of a tDNA cluster in 6p22.1 showing Pol III occupancy in the four cell types. Note that many tDNAs are differentially enriched with Pol III between cell types.

