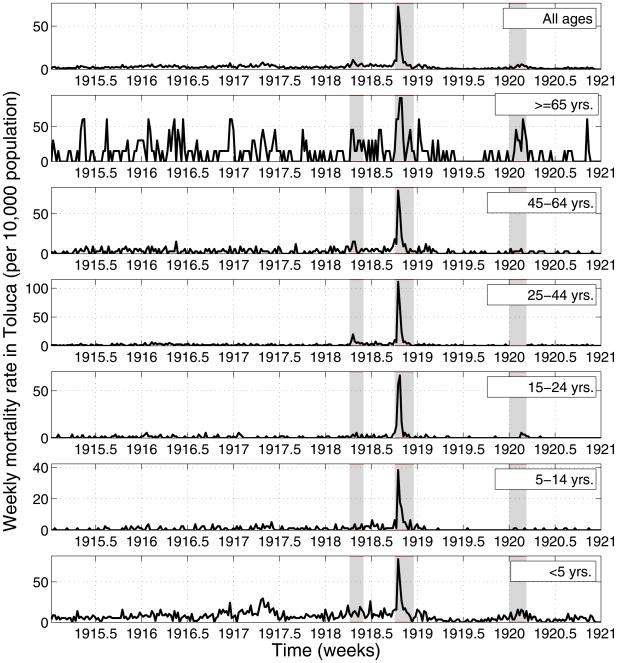
Figure 2.
Age-specific weekly time series of respiratory mortality per 10,000 people in the city of Toluca, Mexico State, 1915–1920. Areas shaded in red highlight 3 time periods of high mortality associated with three waves of the 1918–20 pandemic occurring in spring (Apr-2 to Jun-3, 1918), fall (Oct-1 to Dec-23, 1918), and winter (Jan-1 to Mar-11, 1920).

