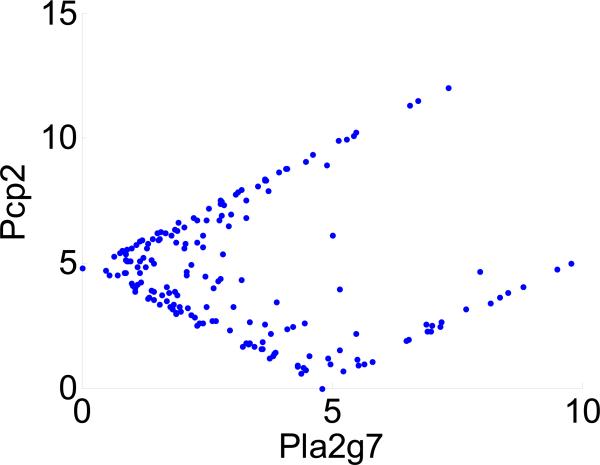
Figure 1.
An example of nonlinear correlation observed in the microarray study (in Section 4). Nonlinear correlation can be detected by maximal local correlation (M = 0.93, p = 0.007), but not by Pearson correlation (C = –0.08, p = 0.88) between genes Pla2g7 and Pcp2 (i.e., between two columns of the distance matrix). Pla2g7 and Pcp2 are negatively correlated when their transformed levels are both less than 5. These two genes are, otherwise, positively correlated. More experimental and data processing details are provided in Section 4.

