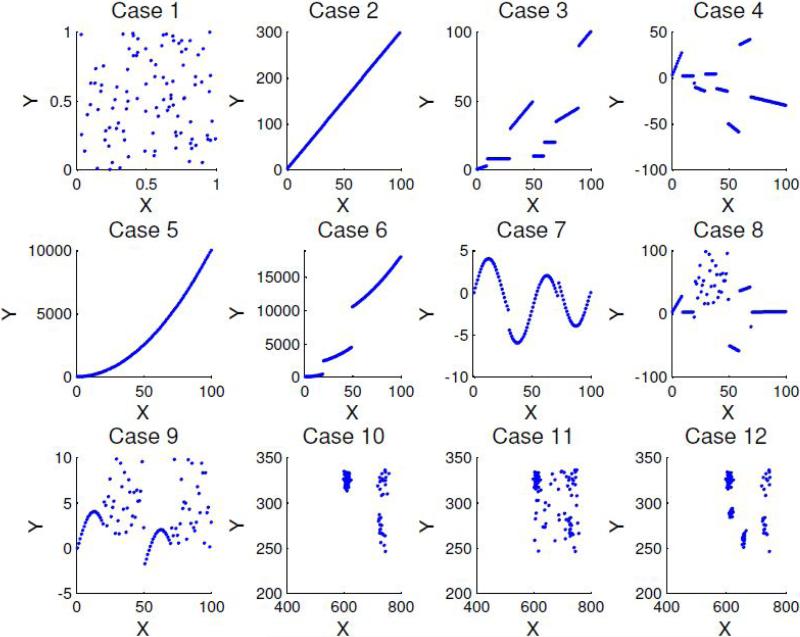
Figure 3.
Twelve simulated cases. 1) random points; 2) a straight line; 3) broken nondecreasing straight lines; 4) broken straight lines; 5) a continuous monotonically increasing curve; 6) broken monotonically increasing curves; 7) three partial sine waves; 8) a mixture distribution of Cases 1 and 4; 9) a mixture distribution of Cases 1 and 7; 10) three clusters; 11) a mixture distribution of Cases 10 and 1; 12) five clusters.

