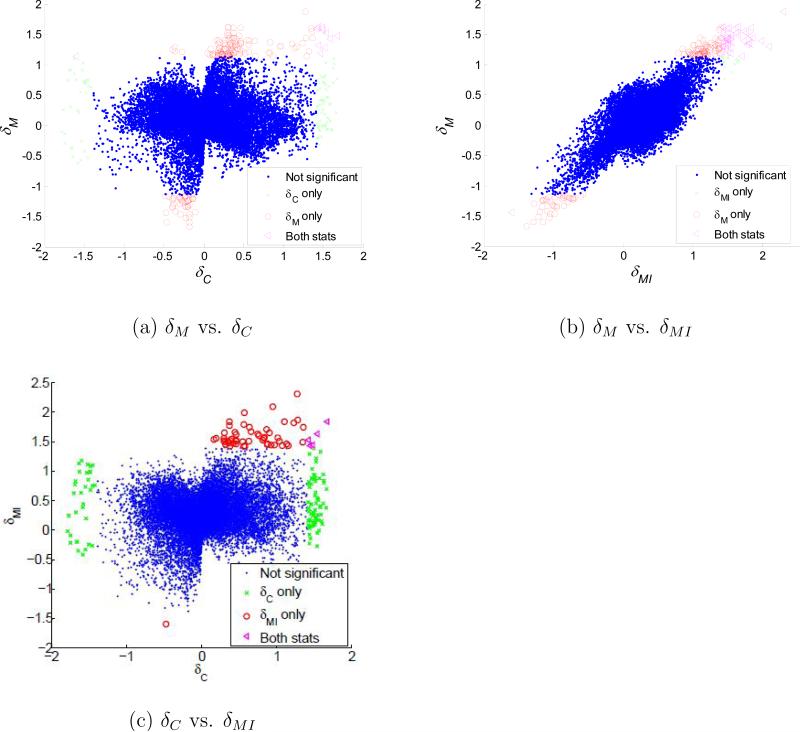
Figure 7.
Scatter plot between different association changes measured between wt and rd mouse. (a) δM and δC can identify different association changes; (b) δM and δMI have high concordance, and identify more significant correlation changes than δC. (c) The relationship between δCn and δMI is similar to that between δC and δM in (a).

