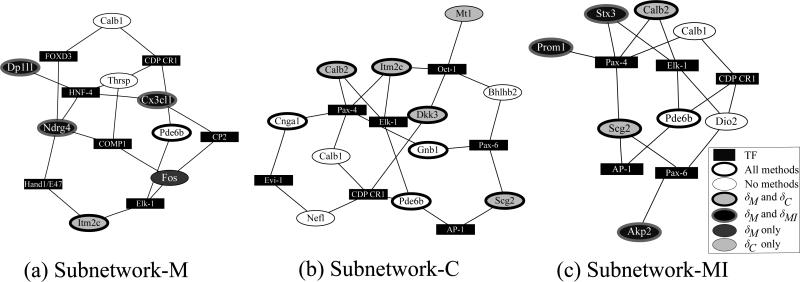
Figure 9.
Three subnetworks, subnetwork-M, subnetwork-C, and subnetwork-MI generated using transcription factor binding information. These subnetworks were generated automatically using the top-ranked genes selected by (a)δM, (b)δC, and (c)δMI, respectively, as “seeds”. Independent of correlation of expression, transcription factor (TF) binding information was then used to “discover” other important genes connected to the “seeds”. The legend of the genes indicates whether these seed or discovered genes are also identified by statistics as important candidates. “All” means all three methods, and “none” means none of the statistics.

