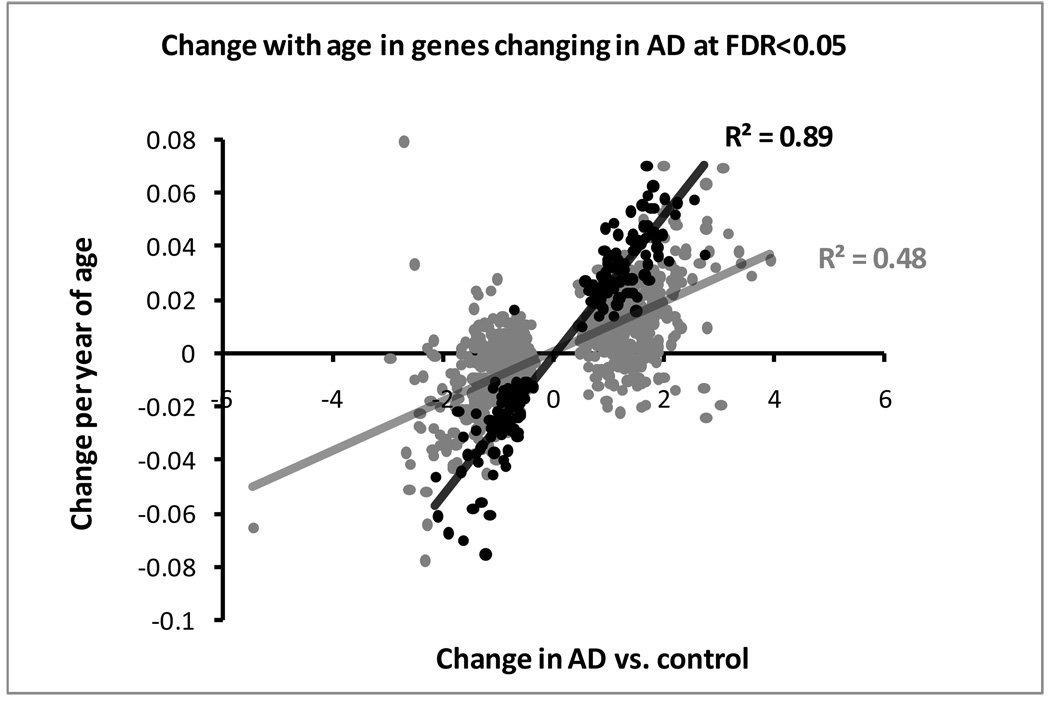
Figure 2.
Scatter plot of effects on gene expression (linear model parameter estimates) of genes that change significantly in AD at FDR <0.05. Black and grey dots correspond to genes that change significantly with age at FDR <0.4 or not. A strong directional correlation is observed, stronger for genes with a significant age effect.

