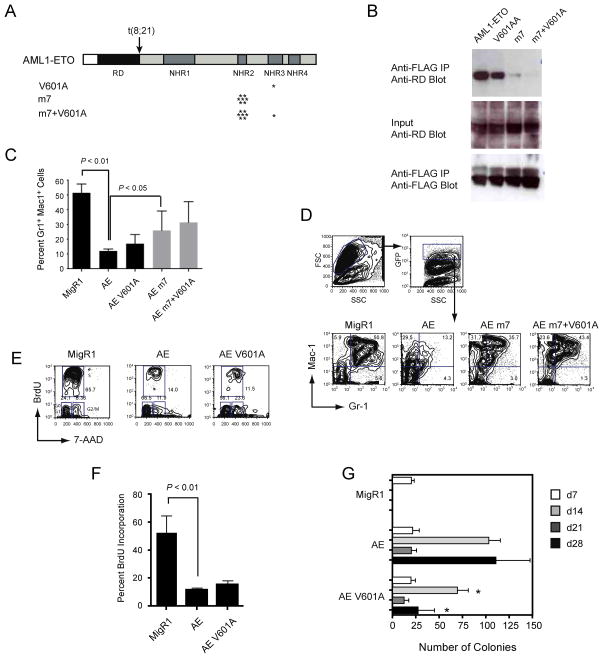
Figure 5. AML1-ETO is unaffected by mutations that impair PKA (RIIα) binding.
(A) Schematic diagram of AML1-ETO and the location of mutations (asterisks) that disrupt oligomerization (m7) and the binding of PKA (RIIα) (V601A).
(B) Cos7 cells were co-transfected with AML1-ETO and its mutated derivatives along with FLAG-tagged PKA (RIIα). Top panel; cell lysates immunoprecipitated (IP) with anti-FLAG and blotted with antibody to the Runt domain (RD) in AML1-ETO. Middle panel; 10% of input lysate blotted with anti-RD to detect AML1-ETO proteins. Bottom panel; membranes from the top panel were reprobed with anti-FLAG antibodies.
(C) Effect of mutations on AML1-ETO’s (AE) repression of granulocyte differentiation of primary Lin− BM cells following seven days of culture in the presence of IL3, IL6, SCF, and G-CSF. Plotted are triplicate samples from two independent experiments (n=6). Error bars represent 95% confidence intervals. Significant differences from AE are shown (ANOVA and Dunnett’s multiple comparison test).
(D) Granulocyte differentiation as assessed by the percentage of Gr1+Mac1+ cells. Cells within the forward and side scatter gates were further gated for GFP expression, and GFP positive cells examined for Mac1 and Gr1 expression. The V601A mutation did not significantly attenuate either AE’s activity or that of the AE m7 mutant. The data are included in the summary graph in panel C.
(E) Representative flow of BrdU incorporation 48 hours after the transduction of Lin− BM cells with MigR1 expressing GFP, AE, or the AE V601A mutant. Forward/side scatter and GFP (not shown) were gated as described in D.
(F) Percentage of GFP+ cells that had incorporated BrdU following a one-hour BrdU pulse. Data are from two experiments each with triplicate samples (error bars = 95% confidence intervals, significance determined by ANOVA and Dunnett’s multiple comparison test).
(G) Serial replating of BM cells. Graphs represent the average number of colonies from each round of replating in the presence of IL3, IL6, and SCF. Day 7 represents colony numbers per 103 cells plated and days 14, 21, and 28 from 1×10⁴ plated cells. Numbers are averaged from three experiments, each containing triplicate samples. The numbers of colonies derived from AE V601A transduced cells were significantly lower than those from AE transduced cells at d14 and d28 (P < 0.01, ANOVA and Dunnett’s multiple comparison test).

