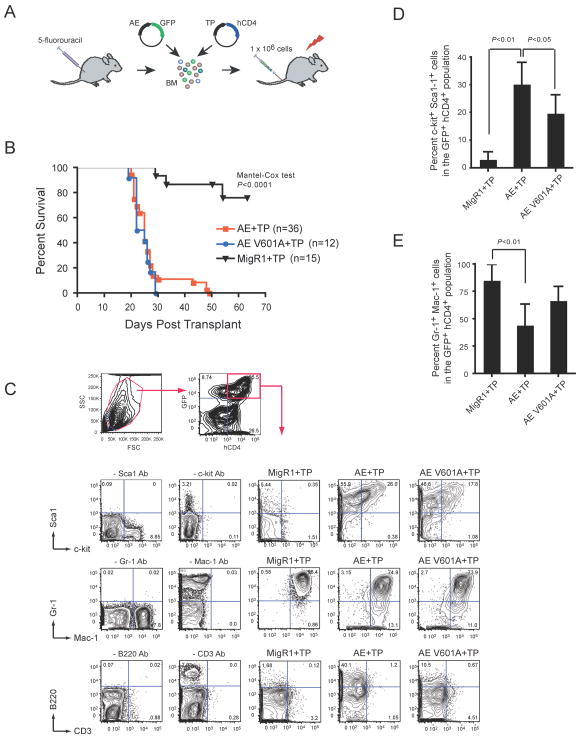
Figure 6. The V601A mutation in AML1-ETO does not impair its leukemogenic activity.
(A) Schematic of transplantation protocol. BM mononuclear cells harvested from 5-fluoruracil treated C57BL/6 mice were co-infected with MigR1 expressing AE (or AE V601A) and TEL-PDGFβR (TP). IRES-mediated expression of GFP marks AE expressing cells while hCD4 marks TP expressing cells. Retrovirally transduced cells (1 × 10⁶) were transplanted along with 2 × 10⁵ normal BM cells into lethally irradiated mice.
(B) Kaplan-Meier survival curve of mice after transplantation with retroviruses expressing AE or AE V601A plus TP. Control mice expressing MigR1 (+GFP) and TP (+hCD4) are shown. The study endpoint was 63 days. The number of mice in each group is indicated.
(C) Whole BM of diseased mice was gated based on forward and side scatter characteristics and subsequently analyzed for expression of hCD4 (TEL-PDGFβR) and GFP (AML1-ETO). GFP+hCD4+ cells were then analyzed for the expression of myeloid and progenitor markers. Plots are from a single animal that is representative of the experimental group. The dropout antibody controls were performed using normal BM. Although there appears to be a higher percentage of B220+ cells in the AE+TP versus the AE V601A+TP samples, this difference was not significant (not shown).
(D) The percentage of GFP+ hCD4+ BM cells that were positive for both c-kit and Sca-1. Error bars indicate 95% confidence intervals. AE+TP, n=9 mice; V601A + TP, n = 8, MigR1+TP, n=7. Differences relative to AE+TP were determined using Dunnett’s test and ANOVA.
(E) Differences in the percentage of GFP+hCD4+ BM cells that were positive for both Gr-1 and Mac-1, analyzed as in D.

