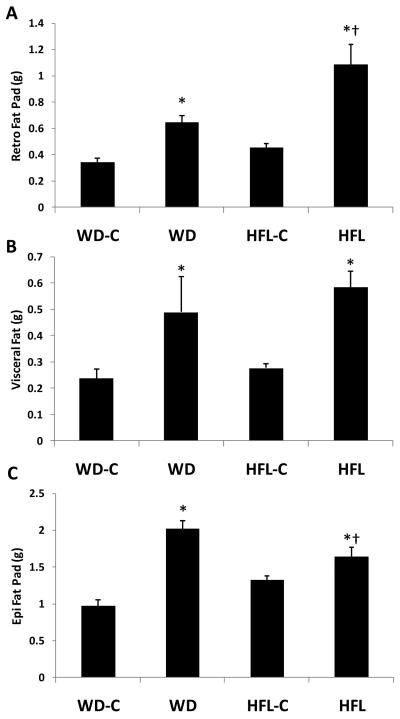
Figure 2. Changes in individual fat pad weight.
Twenty month old male C57Bl/6 mice were placed on Western diet (WD), High Fat Lard diet (HFL), or the respective control diets (WD-C,HFL-C) for 16 weeks and analyzed for changes in fat pad weight, which were manually dissected and weighed. Animals were analyzed for total fad pad weight (A), retroperitoneal fat pad (B), epididymal fat pad (C), and visceral fat pad weight (D). Data are presented as the mean and S.E.M. from 12 animals per group. *P < 0.01 for each high fat diet vs. its control; †P < 0.01 for HFL vs. WD.

