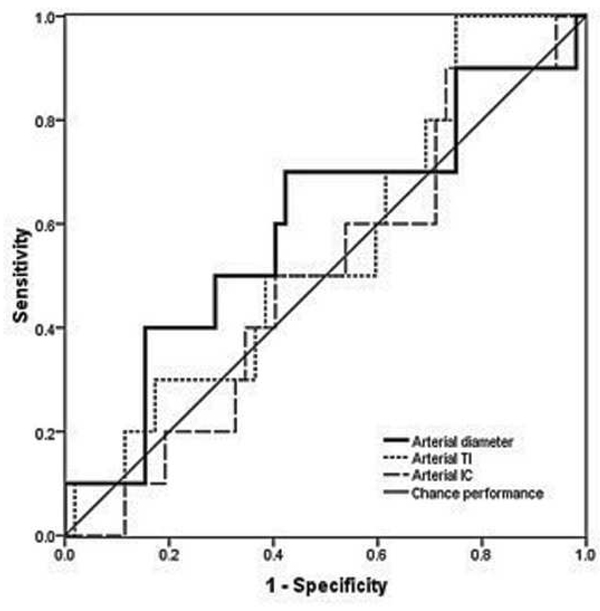
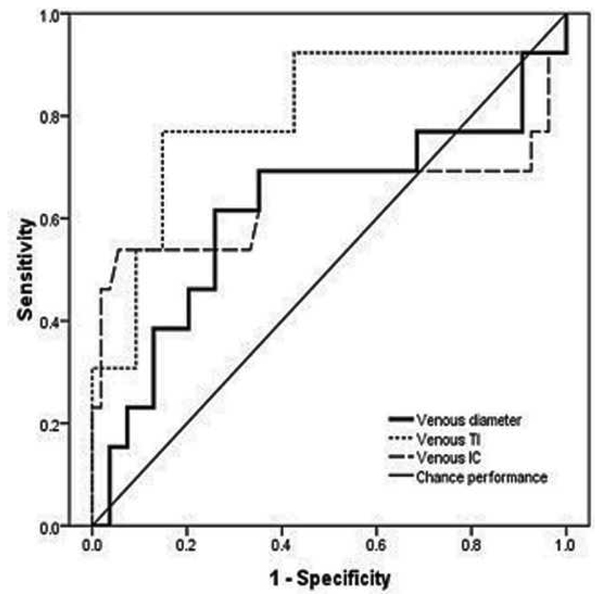
Figure 4.
Receiver operating characteristic curves for detection of plus disease, in infants at risk for retinopathy of prematurity, using a computer-based system to analyze rate of change in vascular parameters of arteries (left) and veins (right) between a first session at 31–33 weeks post-menstrual age (PMA) and a second session at 35–37 weeks PMA. *
*Rate of change in vascular parameters (diameter, tortuosity index [TI], integrated curvature [IC]) is computed as mean change per week in all vessels present in images from both sessions. Sensitivity is plotted against (1-specificity) over a range of cutoff values separating “plus” from “not plus.” Diagonal line represents chance performance (area under curve = 0.5).


