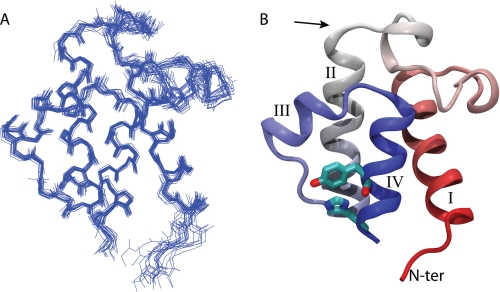
FIGURE 2.
NMR solution structure of VhACP A75H. A shows the backbone overlay of the 20 lowest energy structures of VhACP overlaid on the four α-helices, shown in the same orientation as B. B, shows a ribbon diagram of the lowest energy structure, colored in a spectrum from red to blue from the N to the C terminus, respectively. His-75 and Tyr-71 are shown in stick representation to highlight their stacking interaction. The arrow shows the position of Ser-36.

