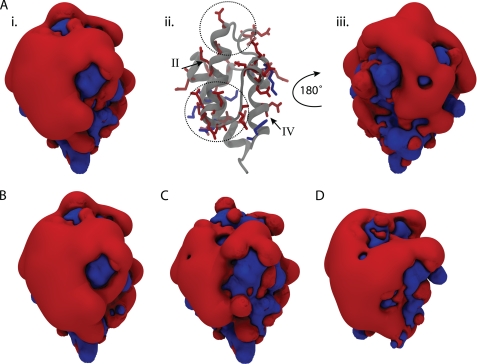
FIGURE 5.
Electrostatic potential plots of various ACPs. Isocontour surfaces are shown at ± 3 kT/e, with the blue surface being cationic, while the red shows the anionic surface. VhACP A75H is shown in A, with the surface plot in the same orientation in i as in the ribbon diagram in ii and rotated about the y axis by 180° in iii. Aii highlights the position of charged residues on the structure of ACP with helices II and IV labeled with roman numerals. The divalent cation-binding sites A and B are highlighted by the upper and lower dotted circles, respectively. B shows the surface of wild-type VhACP, while C shows ACP A75H with two +2 charges placed at the calcium-binding sites. D displays the electrostatic surface plot of wild-type EcACP. B–D are oriented the same as in Ai.

